20. Multiple Linear Regression
Multiple Linear Regression
In the last section, you saw how we can predict life expectancy using BMI. Here, BMI was the predictor, also known as an independent variable. A predictor is a variable you're looking at in order to make predictions about other variables, while the values you are trying to predict are known as dependent variables. In this case, life expectancy was the dependent variable.
Now, let’s say we get new data on each person’s heart rate as well. Can we create a prediction of life expectancy using both BMI and heart rate?
Absolutely! As we saw in the previous video, we can do that using multiple linear regression.
If the outcome you want to predict depends on more than one variable, you can make a more complicated model that takes this into account. As long as they're relevant to the situation, using more independent/predictor variables can help you get a better prediction.
When there's just one predictor, the linear regression model is a line, but as you add more predictor variables, you're adding more dimensions to the picture.
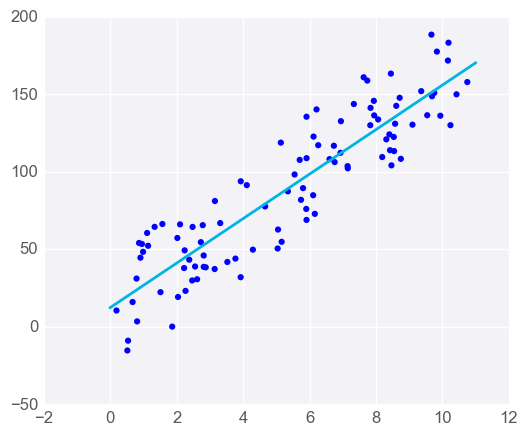
When you have one predictor variable, the equation of the line is
y = m x + b
and the plot might look something like this:

Linear regression with one predictor variable
Adding a predictor variable to go to two predictor variables means that the predicting equation is:
y = m_1 x_1 + m_2 x_2 + b
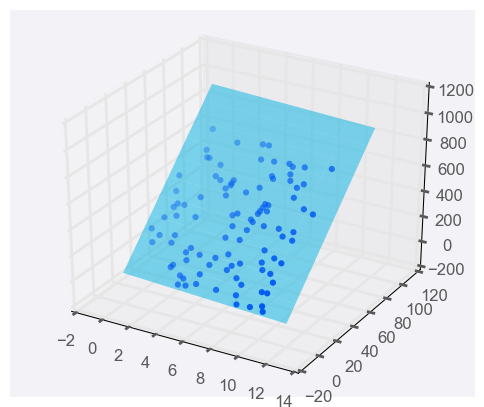
To represent this graphically, we'll need a three-dimensional plot, with the linear regression model represented as a plane:

Linear regression with two predictor variables
You can use more than two predictor variables - in fact, you should use as many as is useful! If you use n predictor variables, then the model can be represented by the equation
y = m_{1} x_{1} + m_{2} x_{2} + m_{3} x_{3}+ … +m_{n} x_{n} + b
As you make a model with more predictor variables, it becomes harder to visualise, but luckily, everything else about linear regression stays the same. We can still fit models and make predictions in exactly the same way - time to try it!
Programming Quiz: Multiple Linear Regression
In this quiz, you'll be using the Boston house-prices dataset. The dataset consists of 13 features of 506 houses and the median home value in $1000's. You'll fit a model on the 13 features to predict the value of the houses.
You'll need to complete each of the following steps:
1. Build a linear regression model
- Create a regression model using scikit-learn's
LinearRegressionand assign it tomodel. - Fit the model to the data.
2. Predict using the model
- Predict the value of
sample_house.
Start Quiz: